Widgets
Widgets are tile components that read or write variable values in real time. Click + Add in the upper right, choose a widget type, and select the variable to bind. Each widget accepts specific variable types.
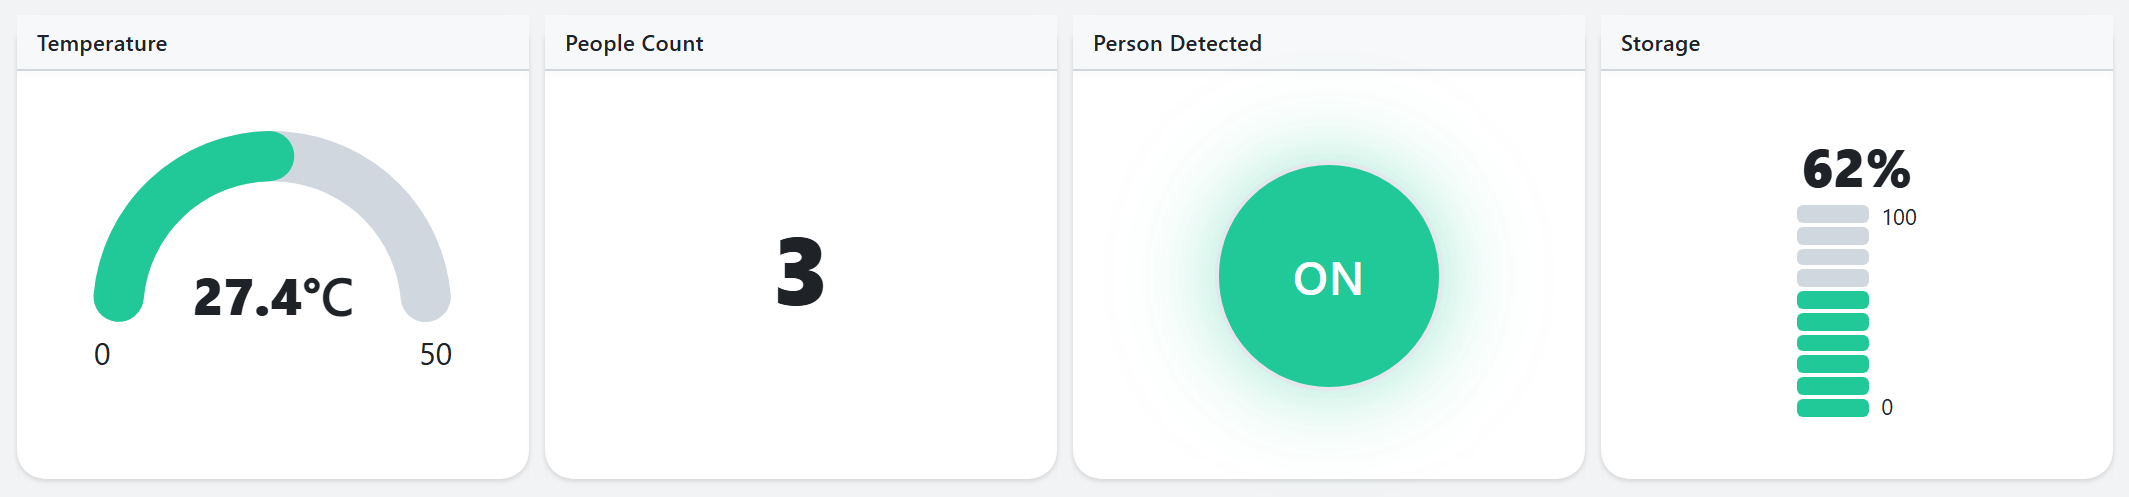
Widget Types
| Widget | Description | Variable Type |
|---|---|---|
| Value | Displays the variable value as text. Text color, decimal places, and unit are configurable. Font size is adjustable per widget (see "Value Widget Font Size" below). | All types |
| LED | Shows a digital variable as an on/off indicator. | Digital |
| Gauge | Displays a numeric value as a gauge, with configurable min/max and unit. Gauge Type selects semicircle or circle. Gauge color, text color, and decimal places are also configurable. | Numeric |
| Switch | Click to toggle a digital variable on or off. | Digital |
| Push Button | On while pressed, off when released. | Digital |
| Slider | Drag to change a numeric value. Step Size sets how much one step changes the value, and Slider Orientation selects horizontal or vertical. | Numeric |
| Input | Enter a value directly to change the variable. | Numeric, Text, Date, Time, Duration, ByteArray |
| Color Display | Displays a color variable's value as a color. | Color |
| Color Picker | Changes a color variable via a palette or HEX/RGB/HSV values. | Color |
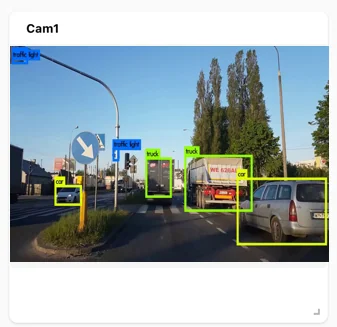
| Camera | Displays the live camera feed. | - |
| Dropdown | Writes a value chosen from a list of options, each pairing a display text with a value. Options are reordered by dragging. | All types |
| Stepper | Increments or decrements a numeric value with +/- buttons. Range, step, and wrap-around are configurable, and holding a button repeats automatically. | Numeric |
| Level Bar | Visualizes a numeric value as ten segmented bars, horizontal or vertical, with min and max labels. | Numeric |
| Media | Displays different images depending on the variable value. Values and images are paired in the Conditional Media table, and a Default Media can be set for values that match nothing. | All types |
| Image Button | A push button with custom images per On/Off state. Images are chosen from uploaded files. | Digital |
| Joystick | Controls two values (X and Y axes) simultaneously by dragging. Supports center-return mode and axis inversion. | 2 Numeric |
| Chart | Plots variable values over time as a live chart. Multiple variables can be shown in one chart, and Chart Type selects line or step. Sampling Interval and Max Data Points set how often values are recorded and how many points are shown. | Numeric |
| Historical Chart | Views past data from a data logging channel as a time-series graph, with time-range selection and multi-variable comparison. Chart Type selects line, bar, or step. In bar mode, values are aggregated as average, sum, minimum, maximum, or delta, and Bucket sets the aggregation interval. Refresh Interval, Time Range, Auto Y-Axis Range, and Variable Colors are configurable. | Data logging channel |
| Historical Table | Views data logging channel data as a table, with time filters, paging, and CSV export. Refresh Interval and Time Range are configurable. | Data logging channel |
| Label | Displays static text without a variable binding. Font size, family, weight, and color are configurable. | - |
Drag widgets to reposition or resize them, and use the edit menu to change the type or bound variable. Duplicate and delete are in the same menu; deleted widgets cannot be recovered.
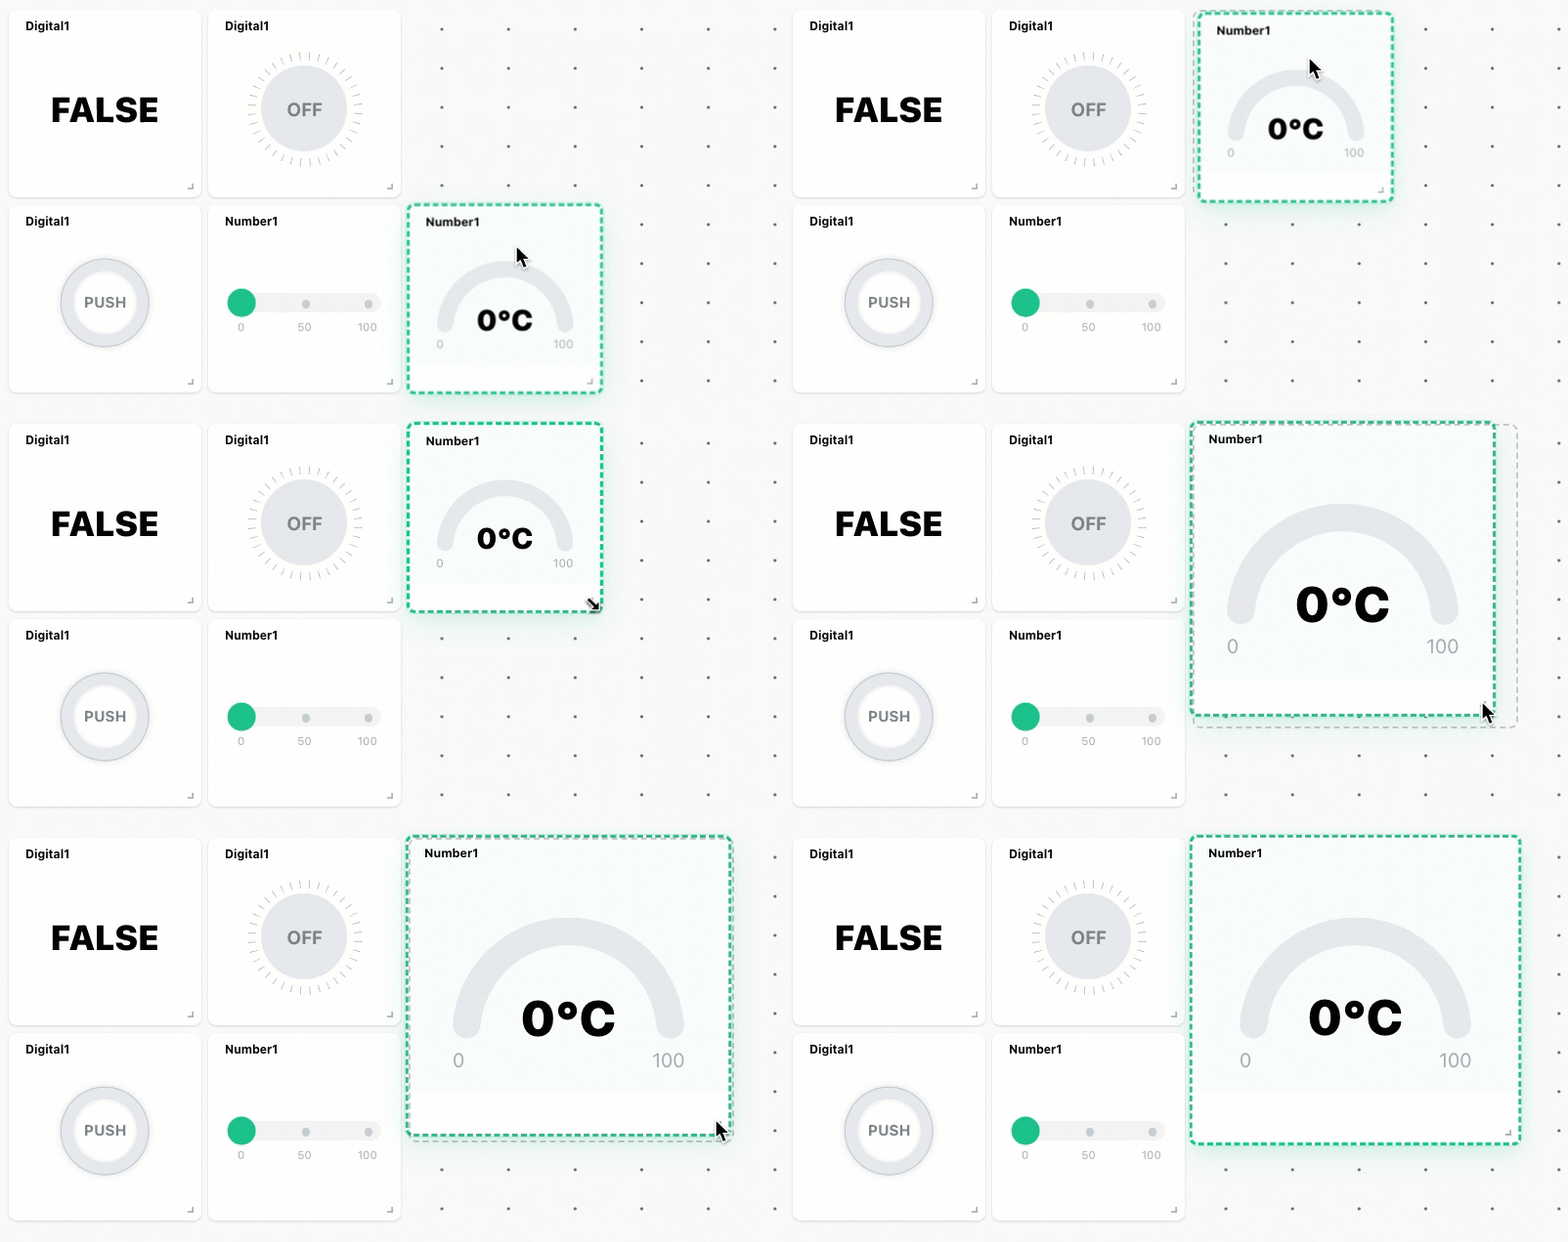
In the Add Widget window, Type lets you change the selected widget type to another type. Right-click an empty area of the dashboard and choose a widget under Add to add it at the clicked position.
Value Widget Font Size
While running, hover over a value widget (tap it on mobile) to show − and + buttons with the current scale (for example, 1.0x) in the top-right corner. Each click changes the font scale by 0.1, within a range of 0.3x to 3.0x. The scale is saved per widget. Once the scale has been changed, an Auto button also appears; clicking it returns to the default size that fits the widget.
Enlarged View of Historical Charts and Tables
While running, click the Maximize button in the header of a Historical Chart or Historical Table widget to open a large viewing window. Changes made there (time range, chart type, aggregation, Y-axis range, visible variables, and the chart/table tab) are saved automatically in the current browser and restored the next time a window for the same logging channel and variables is opened.