Training Faces, Plates, and Custom Classes
Four analyses require you to register or train their targets. All of this registration and training can be performed while the system is running.
Faces
- Open Enroll from a face condition row or the analysis settings.
- Click Add a name and enter the person's name.
- Have the person face the camera and click Enroll. Repeat five or more times, varying the angle and expression slightly. Both eyes must be visible in every shot. Side profiles are not enrolled.
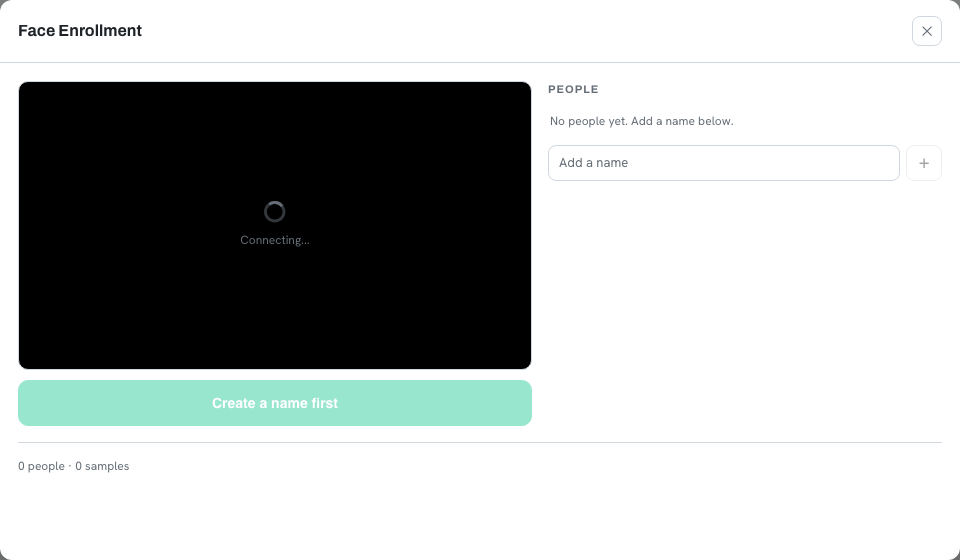
If a person is recognized as someone else, raise the face Threshold and enroll additional photos of both people. In environments where recognition grants access, enable Anti-Spoofing in the analysis settings; it rejects faces presented on photos or phone screens.
License Plates
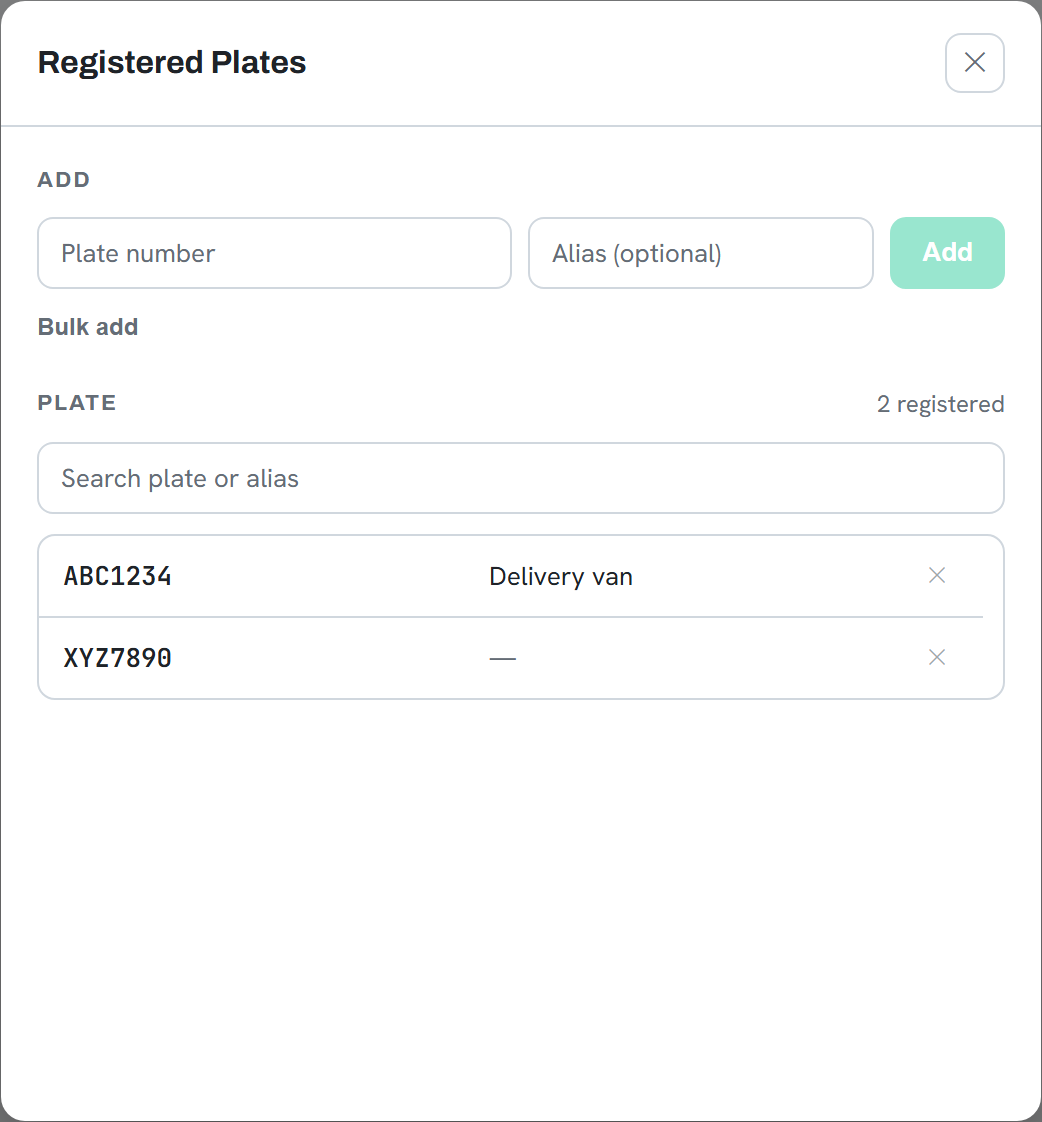
Open Register from a plate condition row and enter the number.
The alias is optional. An alias serves as a display label and can also be used as a
condition's target value, so a condition can match "delivery van" without anyone
remembering the number. Bulk add accepts a pasted list, one per
line, as the plate alone or in plate,alias format.
Set Region in the analysis settings to the installation country. With the wrong region, reading accuracy remains poor regardless of the confidence setting.
Custom Classification
- Open Train from the condition row or the analysis settings.
- Create at least two classes and name them. Two is the minimum; a classifier with one class has nothing to decide between.
- Select a class, set up the scene, and capture. Repeat for each class.
- Click Train and wait for completion.
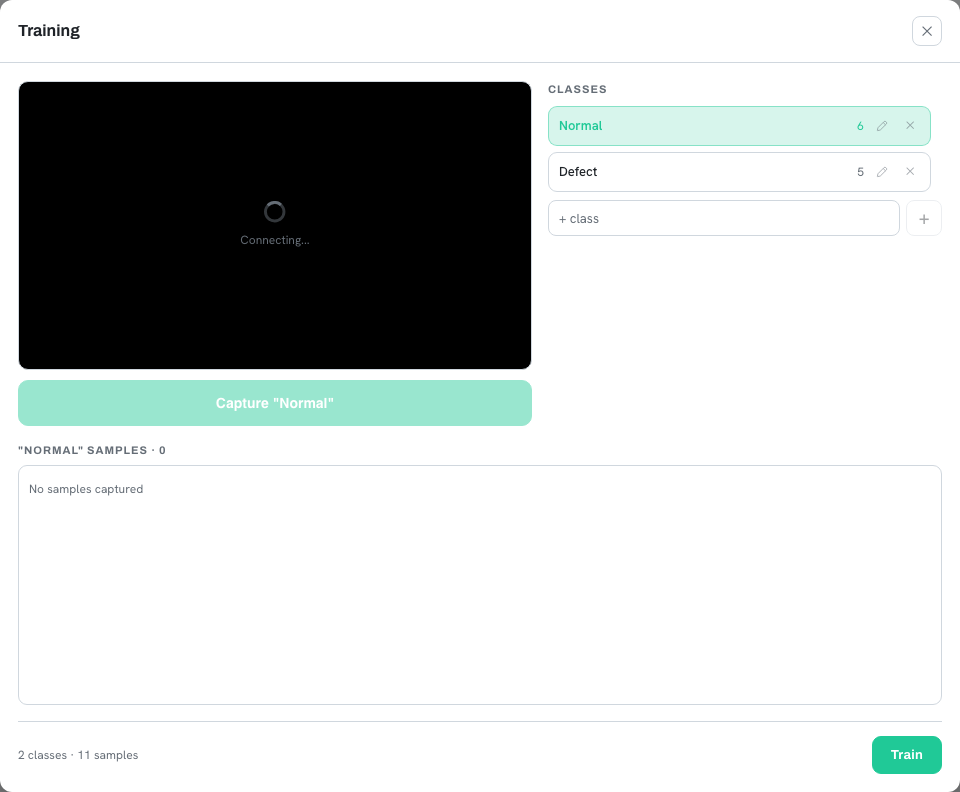
Samples added after the last training are marked as untrained, so you can verify whether the current model reflects the collected data.
Custom Anomaly Detection
Anomaly detection learns only the normal state and reports deviations from it. Fault samples are never registered, which makes it applicable to problems that have not occurred yet. Open Add normals, capture the scene repeatedly while it is in a normal state, and click Train.
Interpreting the score chart after training
Training produces a Normal score distribution. Read it left to right: farther right is closer to a fault, and anything right of the red line is judged faulty. Training holds back about 20 percent of the registered samples to set that line, which is why the displayed count is smaller than the number registered.
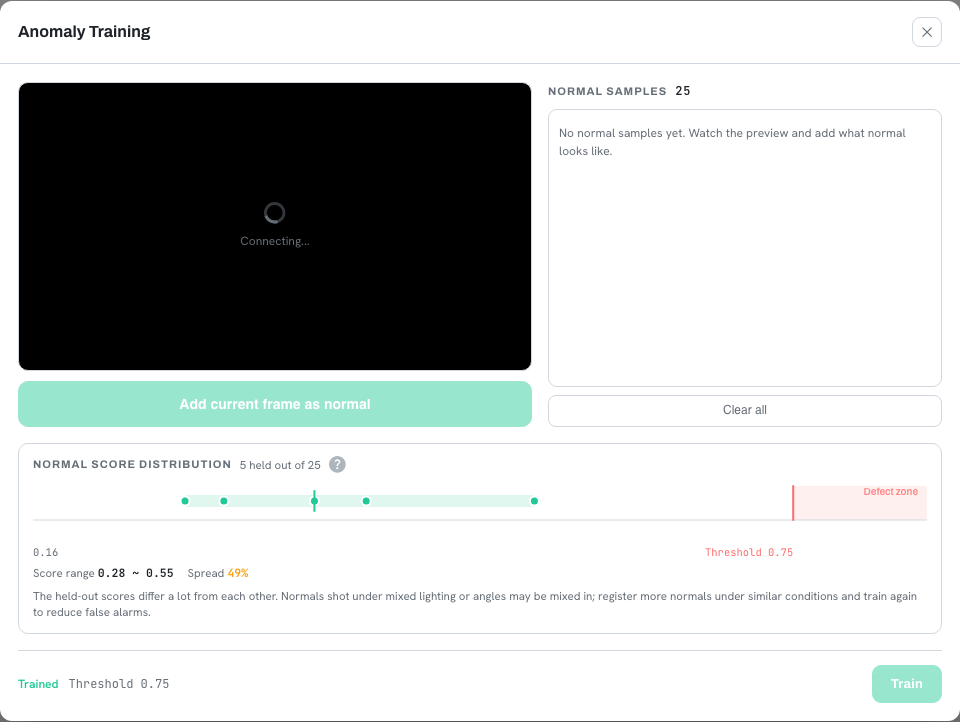
| Distribution | Action |
|---|---|
| Dots grouped tightly left of the line | Training succeeded. No action needed. |
| Some dots past the line | Normal units in that condition may be judged faulty. Register more normals and train again. |
| Dots widely spread | Samples were captured under mixed lighting or angles. Register more under consistent conditions. |
Anomaly detection assumes a fixed camera angle, distance, and lighting. This holds on an inspection station but not on a corridor camera, where it produces continuous false alarms.